给PHP打断点调试,需要PHP、浏览器,IDE三个方面的同时协作,所以整个配置也就需要三个方面。
一、准备的材料
- xampp(Apache+Php)
- PhpStorm
- xdebug
- chrome浏览器
二、详细步骤
1. 配置PHP的Xdebug扩展
- xampp中的php默认已经启用了xdebug,只需在php.ini末尾添加idekey等配置即可。
- 开启后,可以在页面中输出
phpinfo()来检查xdebug是否成功开启,以及idekey是否配置正确。 - 如果没有开启,可以将zend_extension一行的xdebug注释取消
1
2
3
4
5
6
7
/*php.ini*/
zend_extension = "D:\xampp\php\ext\php_xdebug.dll"
xdebug.remote_enable = on
xdebug.remote_port = 9000
xdebug.remote_handler = "dbgp"
xdebug.remote_host = "127.0.0.1"
xdebug.idekey=PHPSTORM
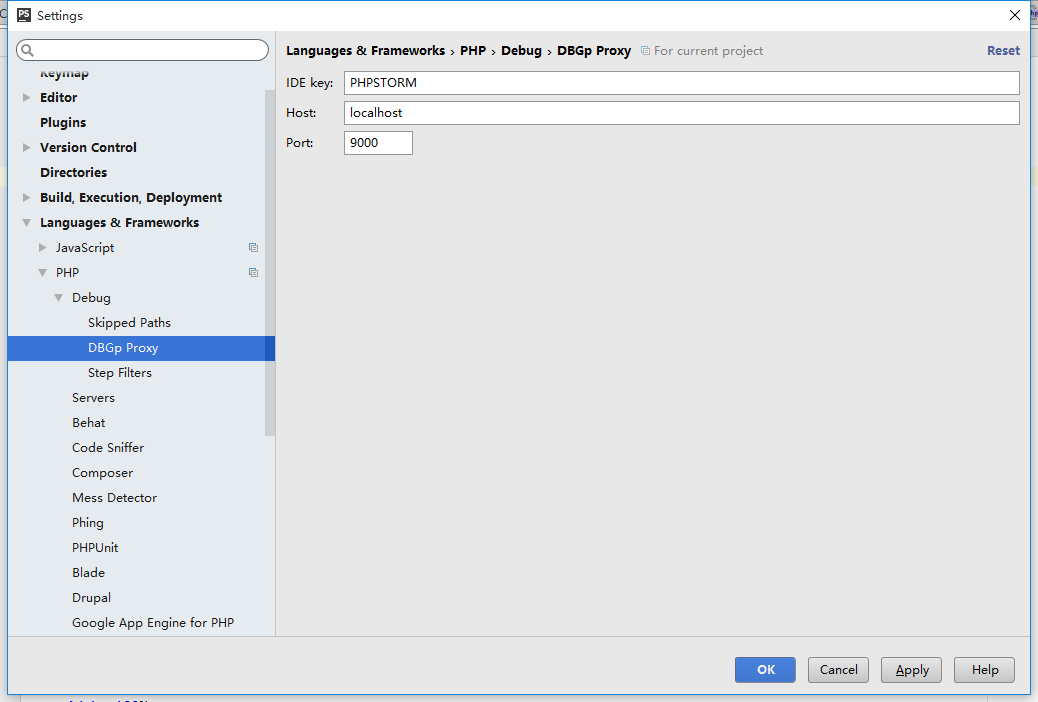
2. 设置PhpStorm
File > settings > Languages&Framworks > PHP > Debug,配置如图
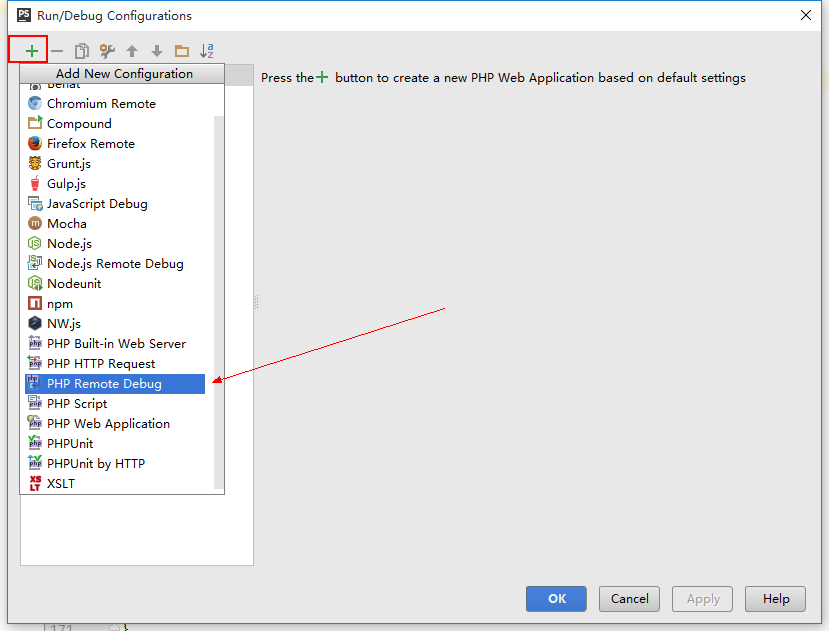
Run > Edit Configurations
- 左上角加号添加
PHP Remote Debug
- 设置
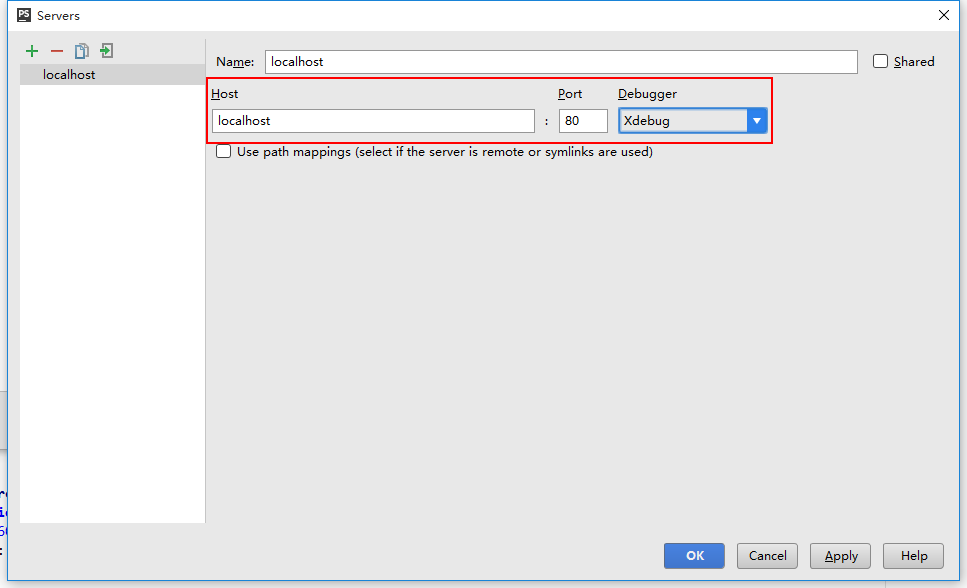
Servers和idekey,并命名为T1
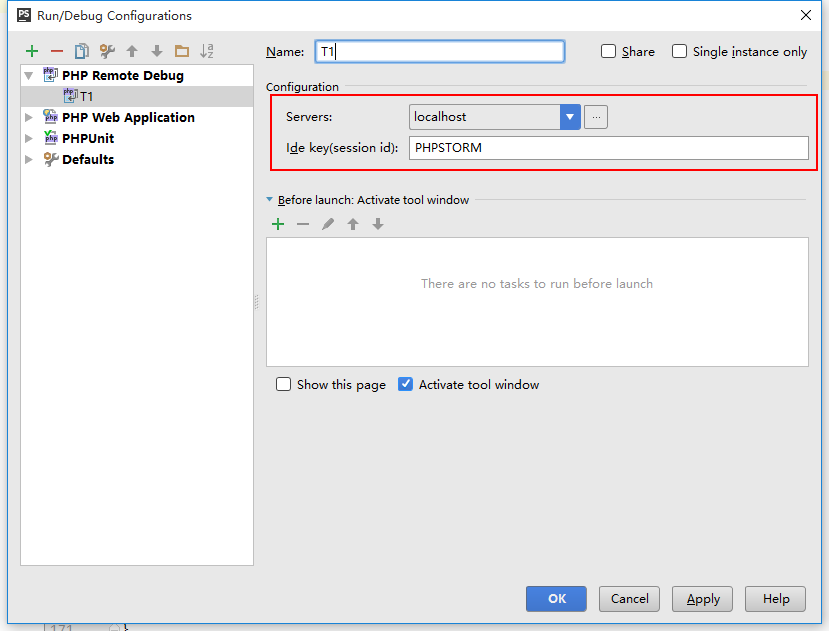
点击上图的 Servers 右侧的三点按钮,在下图中点击左上角加号,添加Server
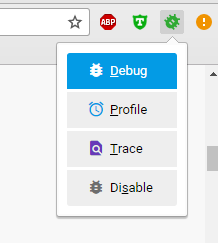
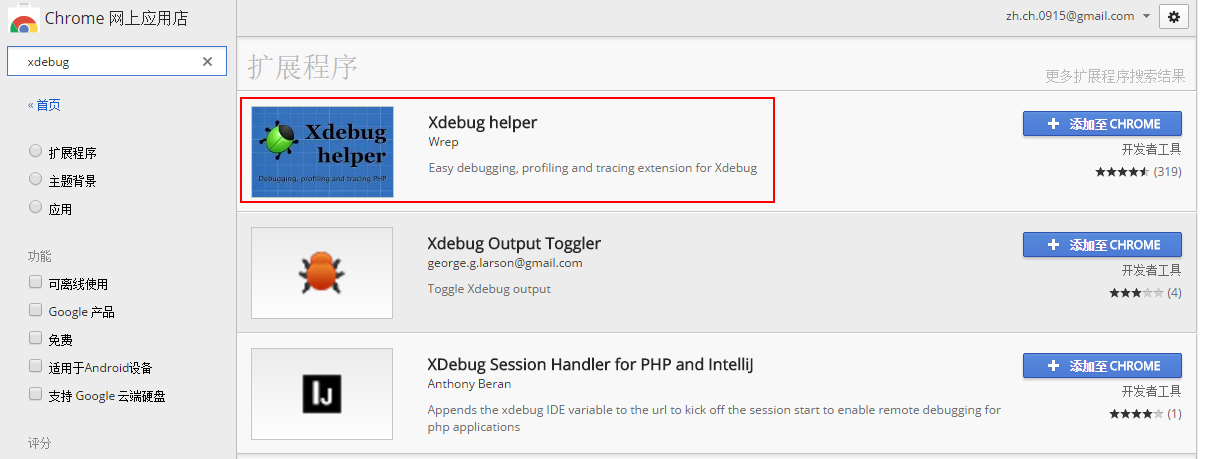
3. 配置Chrome的Xdebug扩展
- 下载Xdebug helper
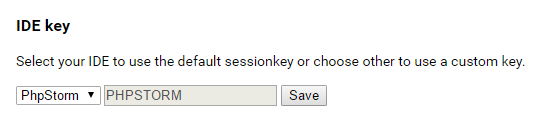
右键扩展图标 > 选项,配置IDE key
4. 开始调试
- 启动Apache
- 在
Phpstoem中给PHP文件添加断点,Run > Debug 'T1' 使用Chrome打开localhost,单击Xdebug图标,点击Debug启用